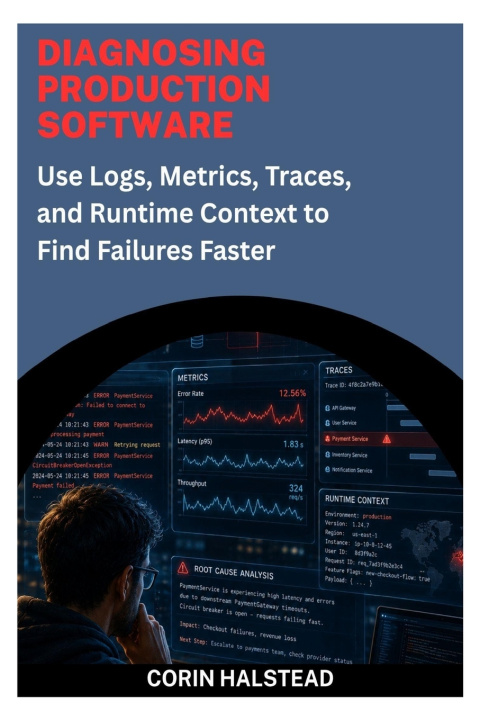
Production failures rarely arrive as clean stack traces.
A request may pass through gateways, services, queues, databases, caches, cloud infrastructure, and third-party APIs before something goes wrong. By the time a user reports the failure, the original condition may already have disappeared.
The challenge is not simply collecting more telemetry.
It is knowing which evidence to trust, what question to ask next, and how to narrow uncertainty until the real failure mechanism becomes clear.
Diagnosing Production Software provides developers, SREs, platform engineers, and technical leaders with a practical framework for investigating failures in modern production environments.
Instead of browsing dashboards until something looks unusual, you'll learn to approach incidents as structured hypothesis testing: define the symptom, bound the affected population, identify plausible mechanisms, collect discriminating evidence, test assumptions, mitigate safely, and verify recovery.
Inside, you'll learn how to:
- Turn logs into structured, searchable event records
- Use metrics to identify scope, trends, saturation, and tail behavior
- Read histograms, percentiles, RED/USE signals, SLOs, and error-budget indicators
- Follow causal paths through distributed traces and asynchronous workflows
- Correlate telemetry using release, service, request, deployment, and workload identity
- Reconstruct runtime context across configuration, topology, traffic, dependencies, quotas, and resource limits
- Diagnose CPU pressure, memory problems, garbage collection, locks, queues, I/O, and network waiting
- Investigate databases, caches, message brokers, DNS, TLS, external APIs, and retry amplification
- Troubleshoot containers, Kubernetes workloads, cloud control planes, networking, probes, and resource throttling
- Control telemetry cardinality, cost, privacy, retention, and access
- Design applications that leave useful diagnostic evidence before incidents happen
- Use continuous profiling, eBPF, and dynamic diagnostics when ordinary telemetry has narrowed the question
- Apply AI-assisted investigation without treating plausible automated explanations as proof
- Build runbooks, dashboards, service diagnostic contracts, and post-incident practices that improve team capability
Realistic scenarios throughout the book demonstrate a central principle: the loudest symptom is not necessarily the cause. A timeout may actually be connection-pool waiting. A CPU alert may have nothing to do with user impact. A missing trace span may represent lost context rather than missing work. A healthy dependency may still be failing for one release, region, or workload.
The book finishes with recommended professional resources and a practical learning path that moves from signal literacy and comparison techniques to instrumentation improvement, systems failure modes, advanced evidence, and team practice.
Whether you are supporting your first production service or improving incident-response practices across an engineering organization, this book will help you replace guesswork with a repeatable diagnostic process.
Stop browsing dashboards. Build evidence. Narrow uncertainty. Find the mechanism that actually failed.