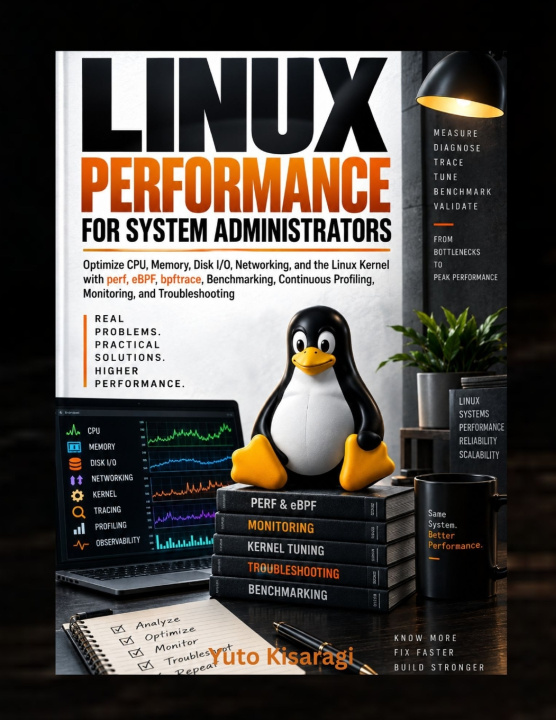
LINUX PERFORMANCE FOR SYSTEM ADMINISTRATORS is a practical guide to diagnosing, optimizing, and validating Linux system performance across CPU, memory, storage, networking, and the kernel.
Designed for system administrators, DevOps engineers, SREs, infrastructure professionals, and advanced Linux users, this book focuses on real-world performance engineering rather than generic tuning advice.
You will learn how to investigate high load, CPU saturation, memory pressure, swap activity, OOM conditions, NUMA imbalance, disk latency, NVMe performance issues, TCP retransmissions, packet loss, application slowdowns, and unexplained P99 latency using a repeatable evidence-driven workflow.
The book covers essential Linux performance tools including vmstat, mpstat, pidstat, sar, iostat, perf, bpftrace, bpftool, fio, stress-ng, sysbench, iperf3, ss, ethtool, tcpdump, numactl, and turbostat. You will also build modern observability and continuous profiling workflows with Prometheus, node_exporter, Grafana, Grafana Alloy, and Pyroscope.
Inside, you will learn how to:
Diagnose CPU scheduling, context switching, CPU affinity, steal time, and container throttling
Troubleshoot memory pressure, page cache, swap, OOM events, huge pages, and NUMA behavior
Measure and optimize disk I/O, filesystems, NVMe storage, queue depth, and latency
Investigate Linux networking, TCP performance, packet drops, retransmissions, MTU issues, and socket behavior
Profile applications with perf, call graphs, and flame graphs
Use eBPF and bpftrace for deeper kernel and application tracing
Build reliable benchmarks and avoid misleading performance tests
Deploy continuous profiling and correlate infrastructure metrics with code-level CPU behavior
Detect performance regressions, establish capacity headroom, and build practical performance runbooks
If you want to move beyond guesswork and develop a disciplined, production-focused approach to Linux performance troubleshooting and optimization, this book provides the tools, workflows, labs, and operational guidance to do it.