Most people who lose money in the share market do not lose it because they lacked information. They lose it because they had too much information and no way to organise it. A company's annual report runs to a hundred pages. A broker's screen shows forty numbers per stock. A finance website shows another sixty. Each number is real, each is calculated correctly, and together they tell you almost nothing unless you know which questions they answer.
Quantfolio was built to solve that problem for its own users. It started as a data pipeline: pull prices, pull financial statements, calculate the standard ratios, and lay them out side by side for a few hundred ASX and US-listed companies.
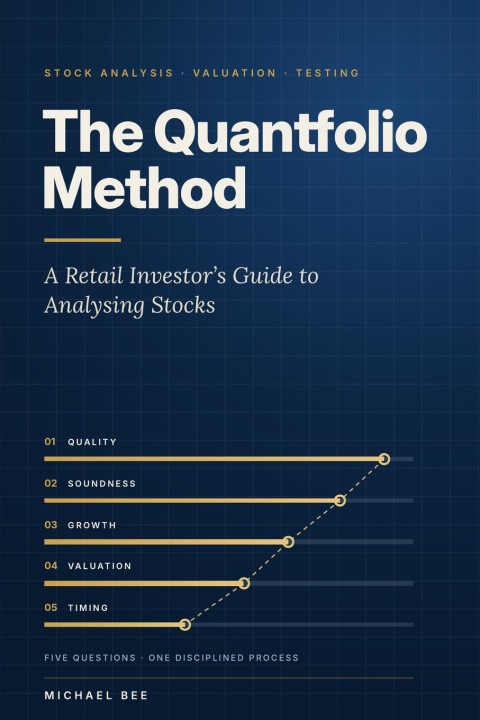
The first version produced a spreadsheet with ninety-four columns per stock. It was accurate, comprehensive and, on its own, close to useless. A reader looking at row after row of return on equity, enterprise value multiples, five different intrinsic value estimates and a dozen technical indicators had no way to know which numbers mattered for which company, or what to do when they disagreed. This book is the result of working through that problem. It describes the framework Quantfolio uses to turn a wall of metrics into a small number of clear questions about a business, and the testing discipline it applies before trusting any number or any rule.
It is written for the individual investor who wants to understand what they own and why, rather than for the professional analyst or the day trader.